

Result view
How to read the result of a finished survey run: key statement, audience, summary, KPIs, questions, themes and action bar.
Every survey run gets its own report. Once the analysis is done, the status changes to Report ready. You always read the report in the same result view: under Result in the Dock and on the study page, in the Library's results, from search, in the Dock from the chat and on the project page. A link without sign-in and the PDF show it too, without the action bar and without opening anything further. On the project page, the action bar is absent as well. A question shows its answers in the same view, without summary and KPIs.
The app computes questions, charts and KPIs from the answers. Iris writes the key statement and the summary; how to change both is explained in Change a report. Reports always appear in the app's look.
Key statement and audience
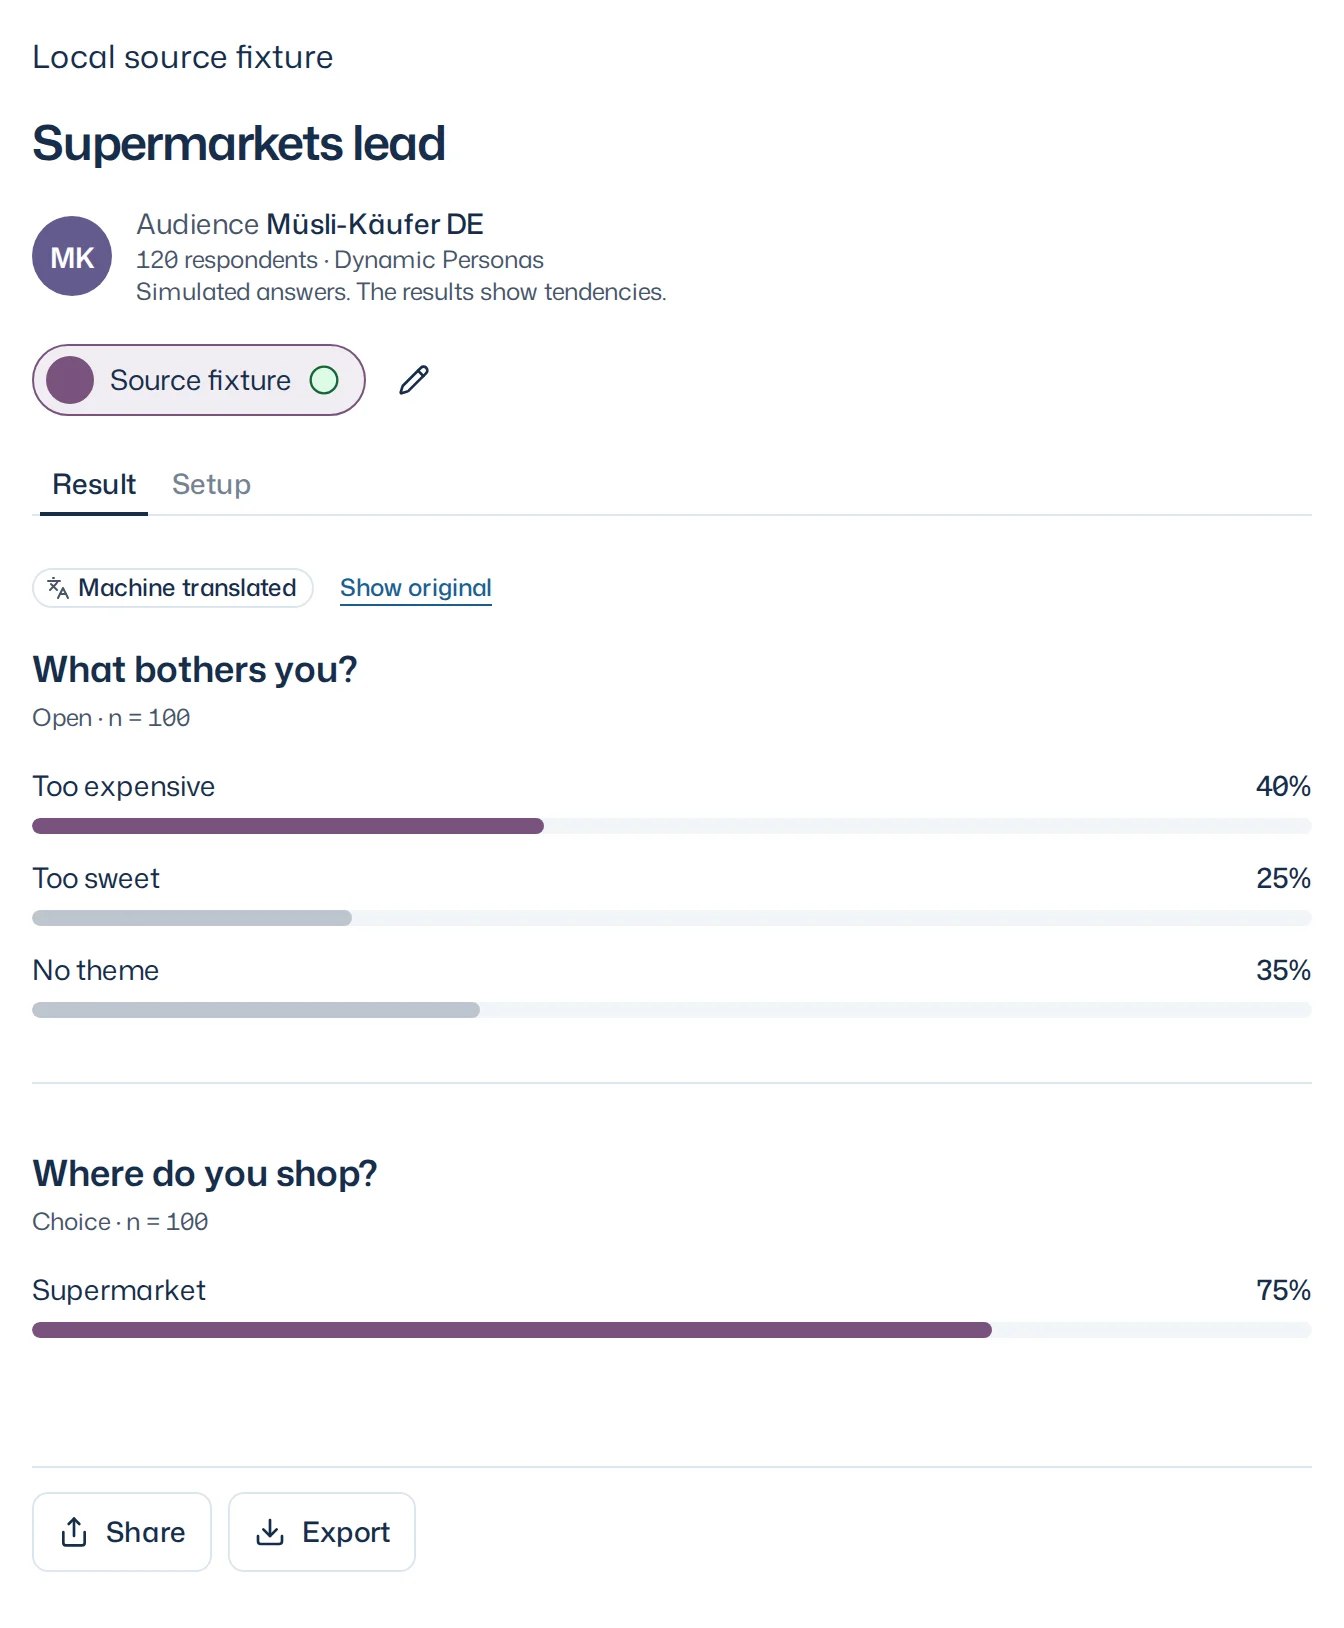
The key statement is the title: the most important result in one sentence, for example Most would buy, younger respondents more than older ones. Iris writes it in German and English; you read it in your app language.
Below it is the run's audience with its number of respondents, country, age and audience type (Dynamic Personas or Premium Twins), always followed by Simulated answers. The results show tendencies. These details come from the survey run, not from the panel's current state. What they mean for reliability is explained in Judge reliability.

Summary
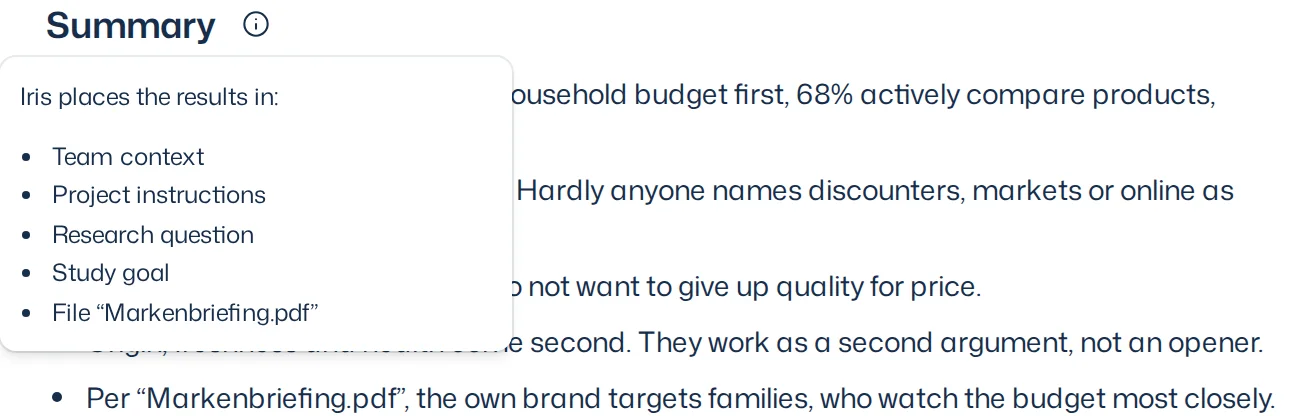
Below the audience is the Summary: in a few points, Iris places the result in the research question, the study goal, the team context, the project's instructions (project context) and the project's files. Every number in it comes from the run's results. What Iris takes from a file, she names with the file's name, for example “Per ‘Brand brief.pdf’, …”. The info icon beside the heading names the context Iris had and the files she used; in the PDF and the link without sign-in, a line below the points says so. Iris reads the files as they were in the project when the analysis started; what you upload or change later does not change that analysis. If Iris could not write a summary, the section is absent; reports from before its introduction have none.
KPIs
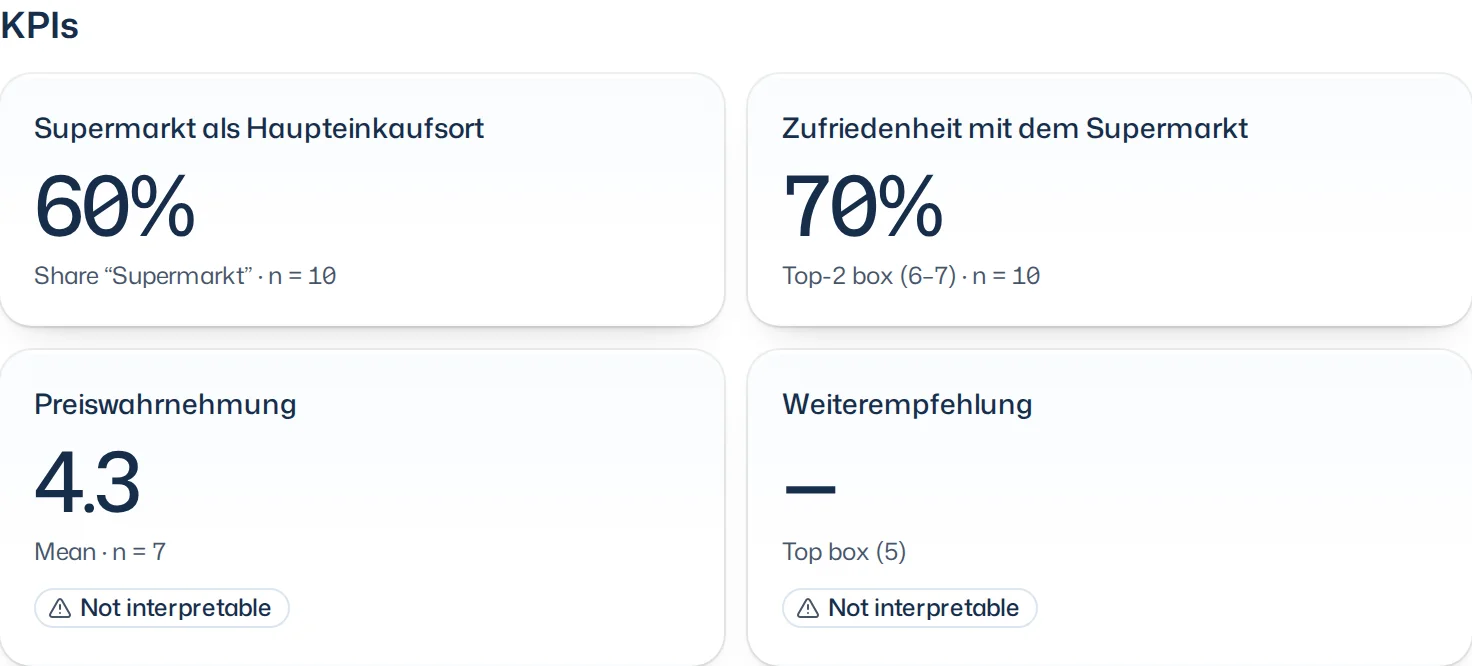
Below it are the KPIs: one card per question marked as a KPI in the setup, with its name, value, aggregation and n, in setup order. Click a card or press Enter on it to jump to its question. If more than a fifth of a question's answers failed, its card carries Not interpretable; without any valid answer, a dash replaces the value. Without a marked KPI the section is absent.
Questions
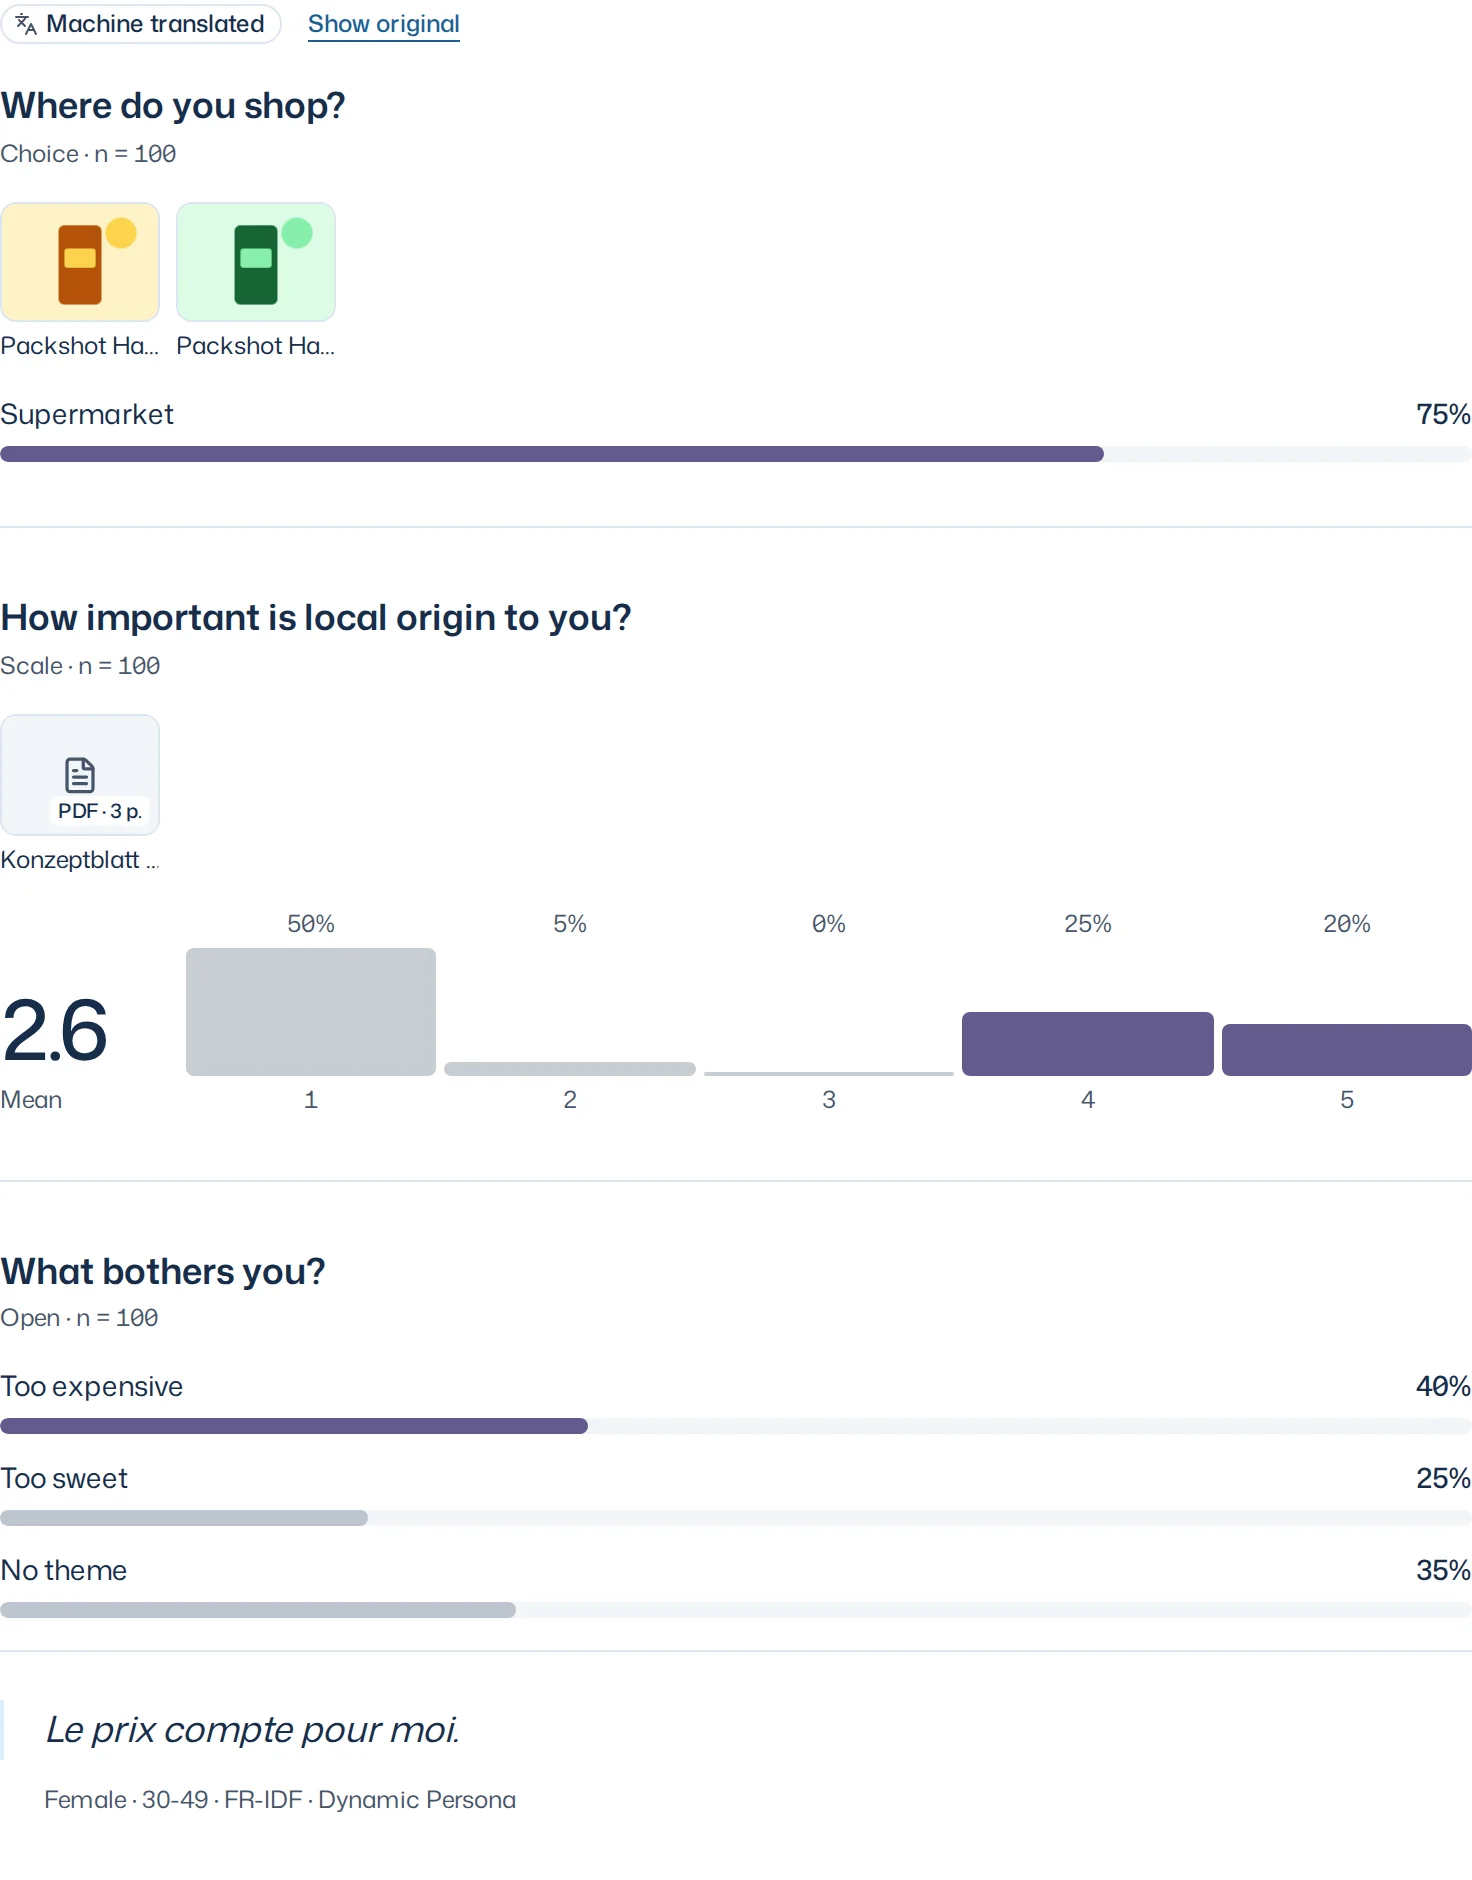
A rule separates the questions. Below each question are its type and the number of answers, for example Choice · n = 120. If a question cannot be identified unambiguously, the heading says Question unavailable. There is no overall winner across questions.
- Choice questions appear as bars with their share, the leading option in the audience's colour.
- Scale questions show the mean and, beside it, the distribution across the scale points.
- Open questions show their themes as bars, No theme included. If the themes are still missing, the report says so and what to do; Iris forms them as a theme list when you ask in the chat. The report keeps the themes of its survey run.
Below a question are the images (stimuli) shown with it, as the survey run showed them; click one to open its preview.
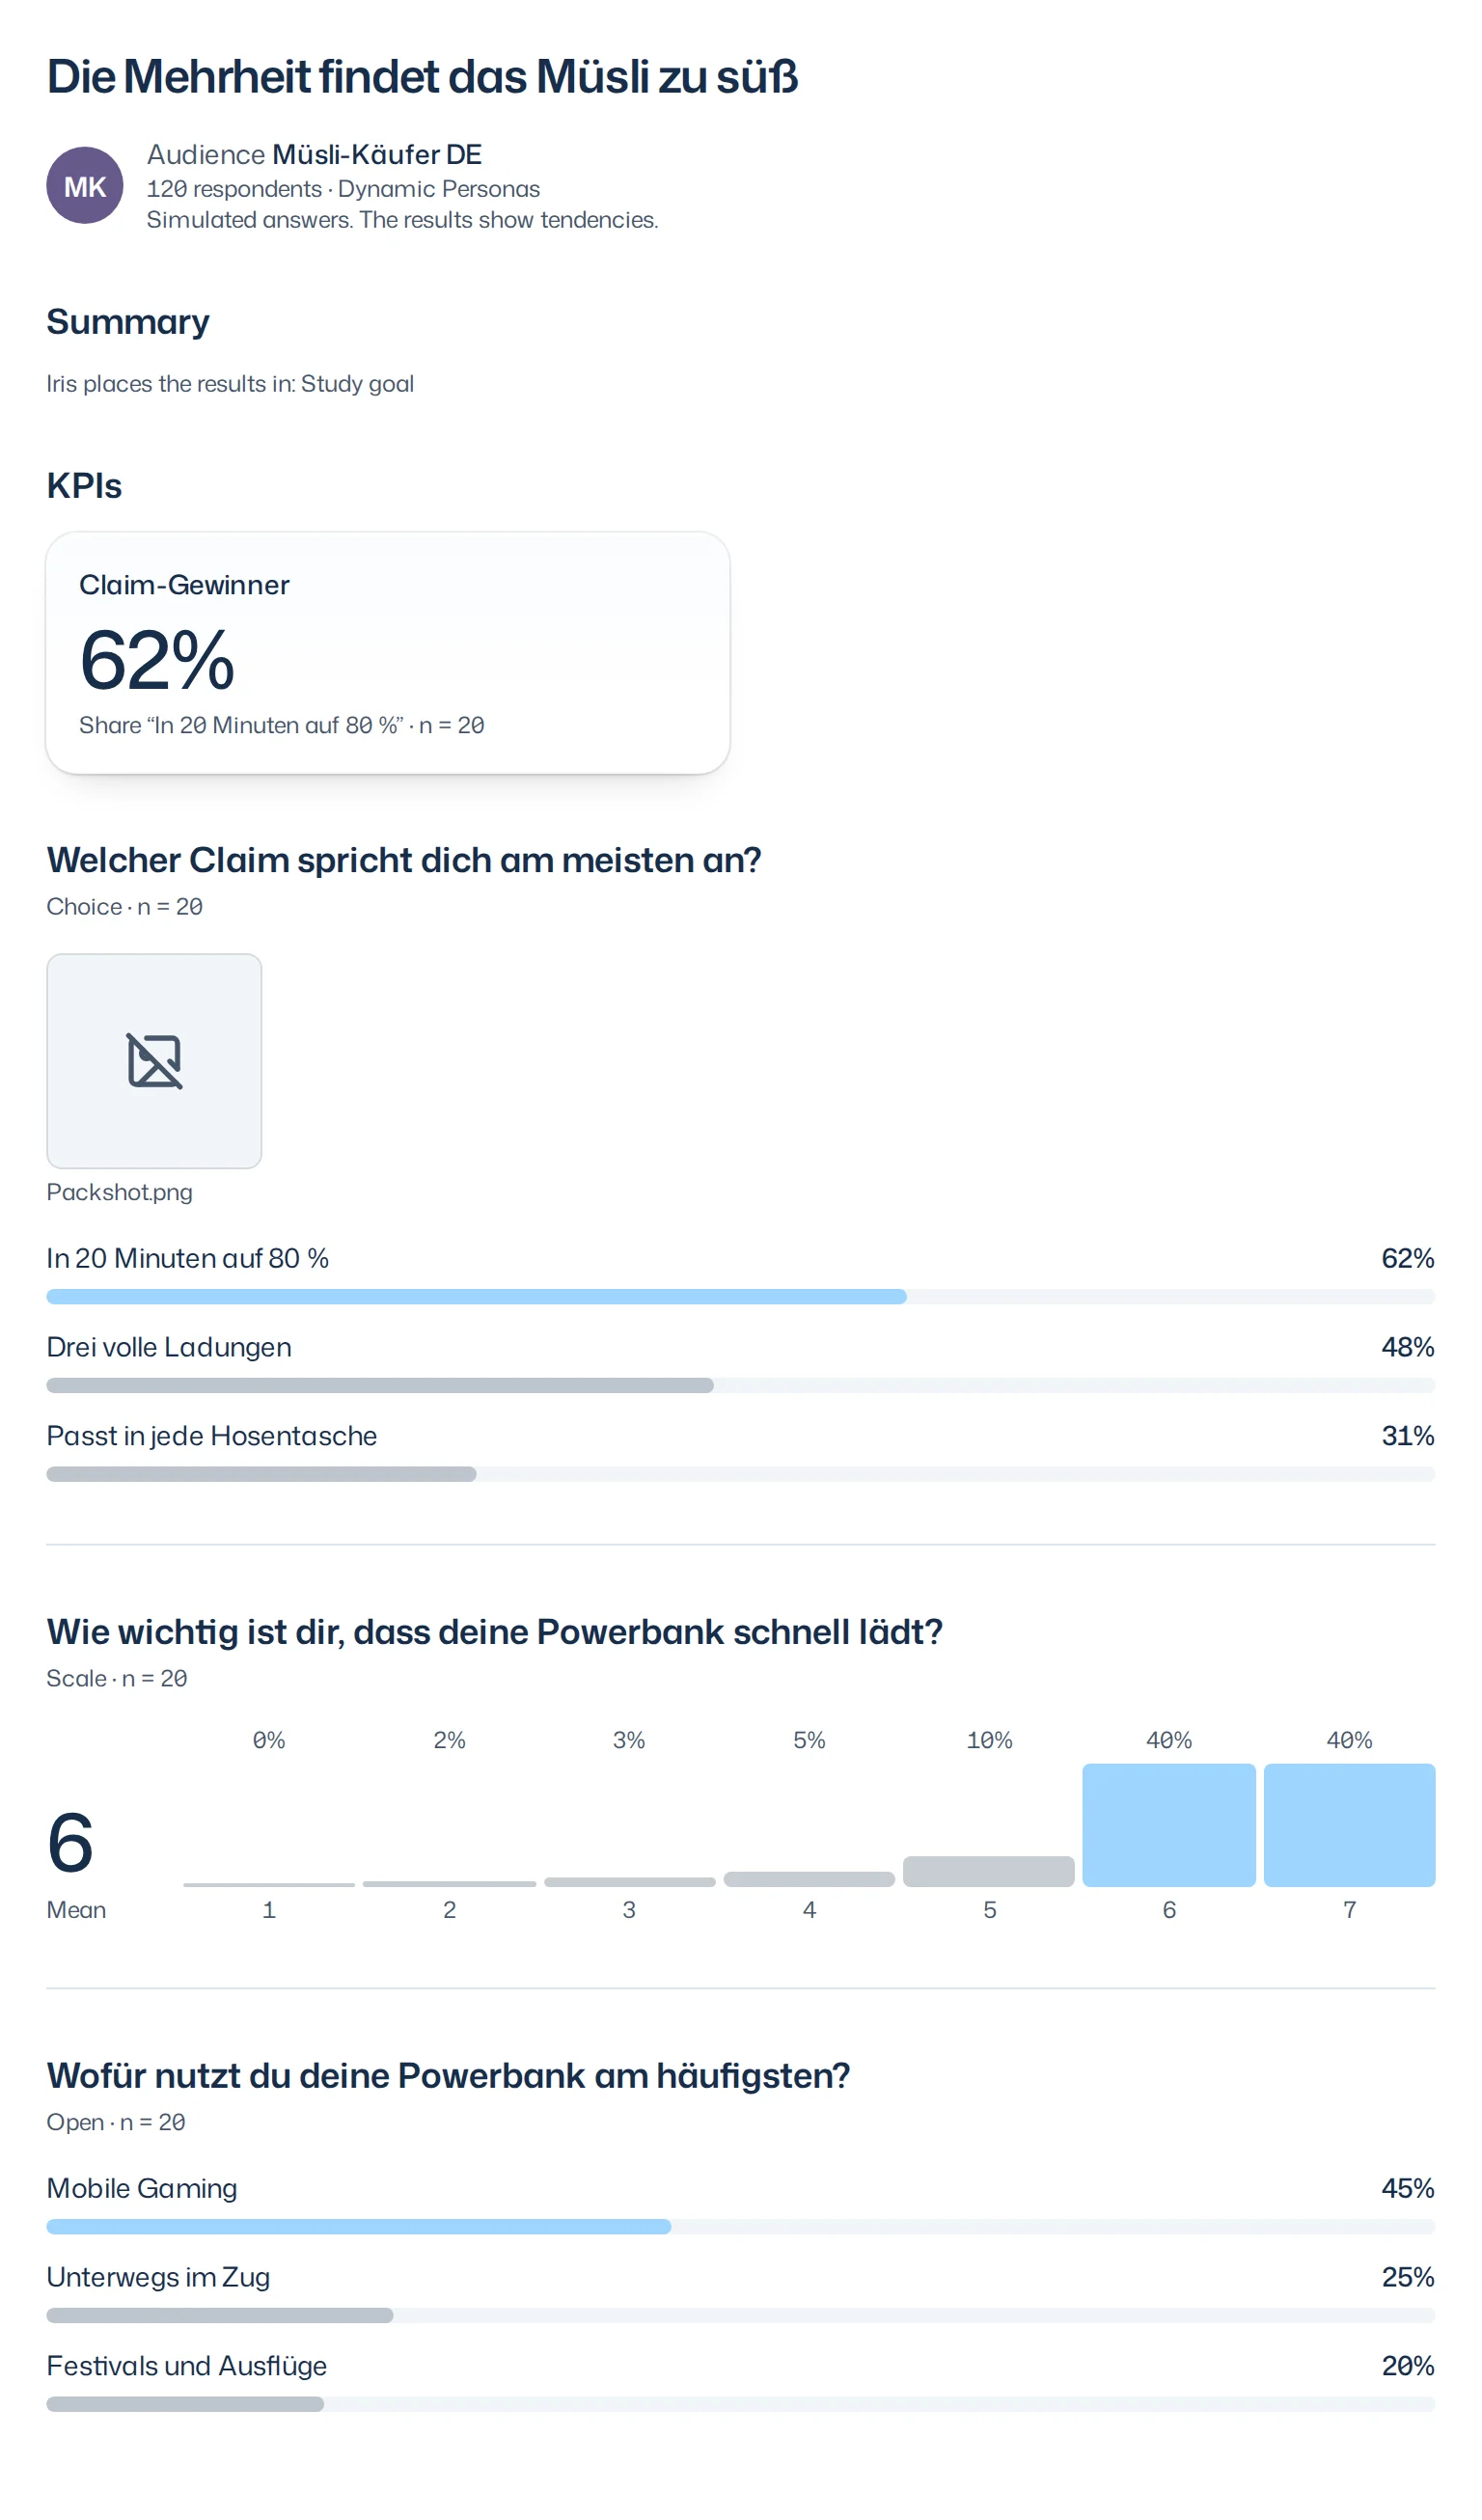
An image loads anew each time it opens and checks access. Without it, for example after you left the team, once a shared link is off or its PDF may no longer be downloaded, the tile shows a crossed-out image icon. The rest of the result stays readable.
New reports show no quotes; you reach the answers through the theme bars. Older reports list quotes below their question, with the respondent's traits, such as gender, age group and region. Click a quote to open the person behind it.
Answers to a theme
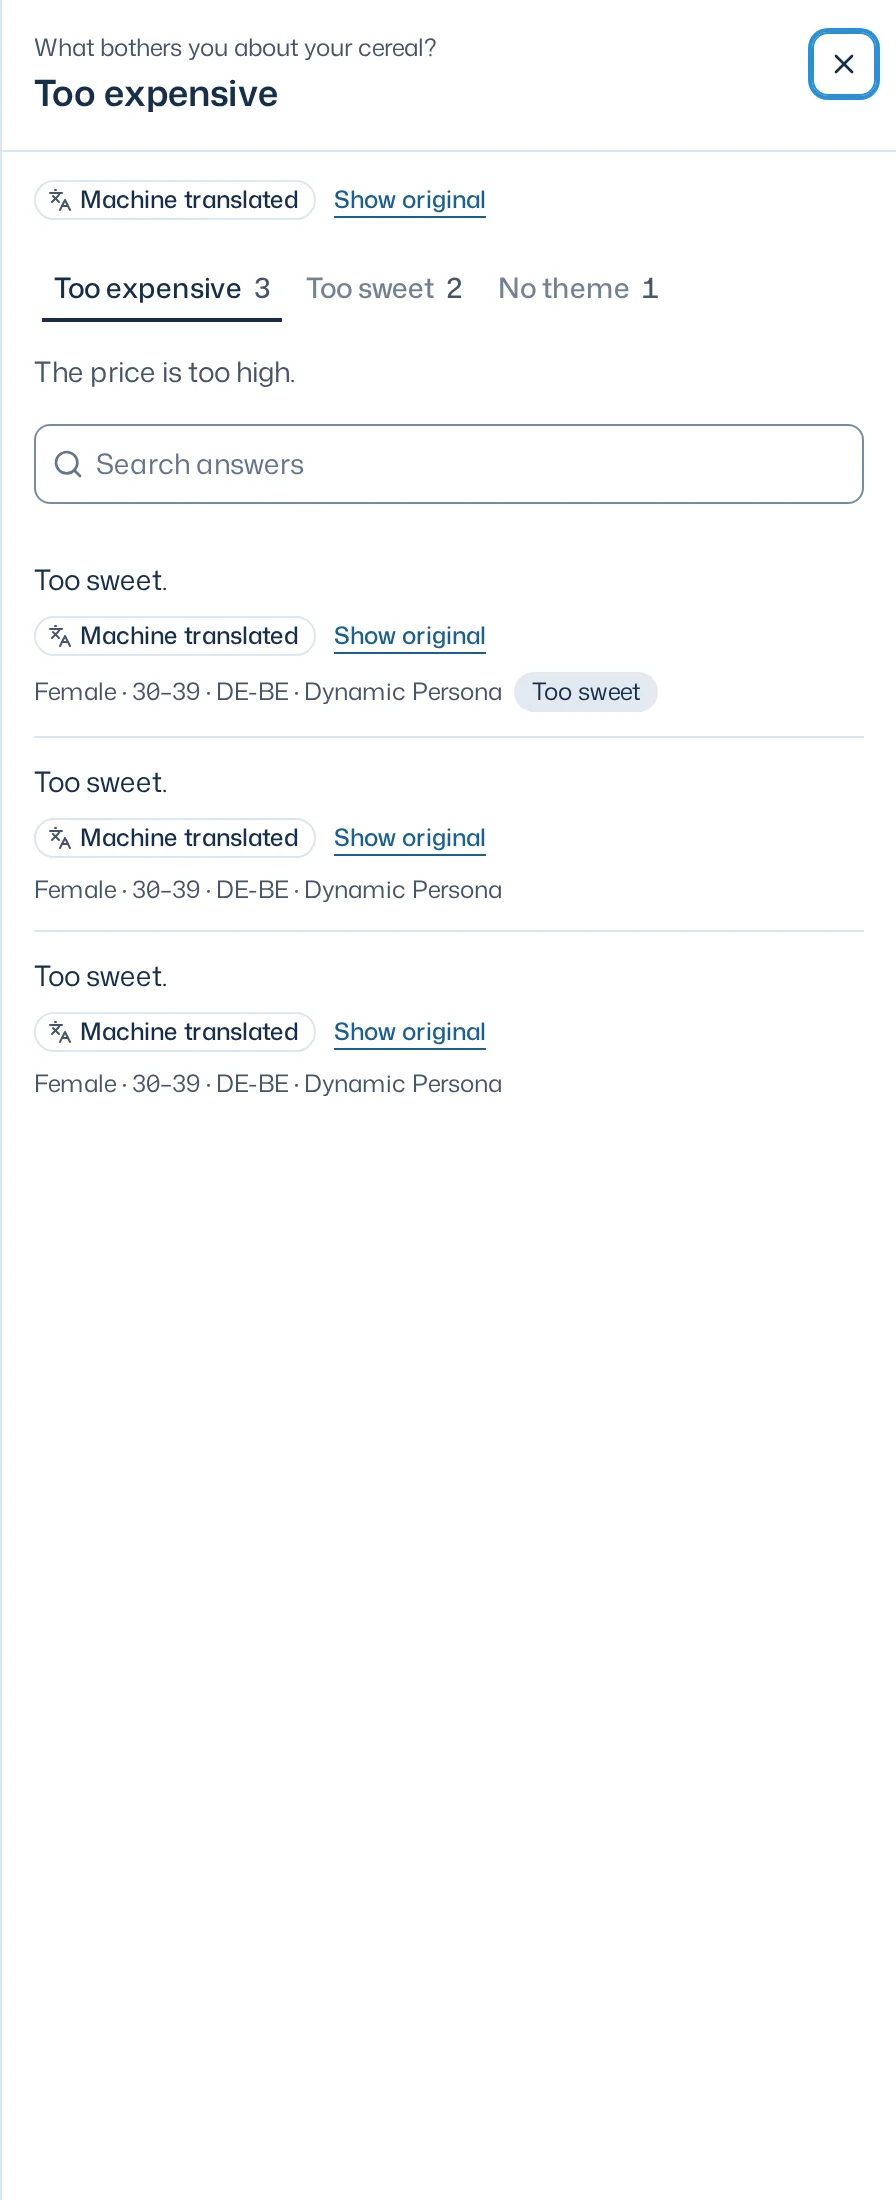
Click a theme bar to open its answers on the right:
- At the top are the question and the theme, below them a tab per theme with its number of answers and a No theme tab.
- Below the tabs is what the theme covers.
- Search answers finds answers with a particular word.
- Each answer shows the respondent's traits and the other themes it belongs to.
Close the panel with the X or with Esc. You revise themes in the chat, for example "Merge price and taste" or "This answer doesn't belong to price".
Labels and translation
Questions, answer options and themes appear in your app language, marked Machine translated. Show original shows the version's original labels; numbers and audience stay the same. What you choose here is also what the PDF prints. While a translation is still running, the original stays visible with Translation follows. In the theme panel, Show original shows the respondent's own wording; only the original proves the exact wording. More in Languages.
If refreshing fails, the last loaded report stays readable under Could not refresh. This is the last loaded state. with Try again.
Action bar
The action bar sits at the bottom:
- Mark for presentation marks the survey run for a presentation; how marks work is explained in Research details.
- Share > Copy team link copies the link for members of your team. Share also holds the link without sign-in to the current version.
- Export downloads the result as PDF, the crosstab or the raw data, see Export.
Ask Iris questions about the result in the Dock's input field or, on a page, with Ask Iris.